Technical Report
Executive Summary
This analysis investigates whether signing large contracts negatively impacts MLB player performance, examining the commonly held belief that financial security leads to decreased motivation and effort. Using data from 300 MLB hitters across the 2018-2025 seasons (1,985 player-seasons), we identified 495 “big contract” events and compared player performance before and after contract signing using OPS and WAR as primary performance metrics.
Key Findings:
- Descriptive statistics show an apparent decline in performance post-contract (ΔOPS = -0.020, ΔWAR = -0.241)
- However, mixed effects regression controlling for age and player-specific effects found no significant contract effect (β = 0.011, p = 0.113)
- Age was the only significant predictor of performance decline (β = -0.004, p = 0.010)
- Players typically sign major contracts at ages 28-31, coinciding with natural performance decline
- 59.3% of players declined post-contract, consistent with normal aging patterns rather than systematic motivational effects
Actionable Recommendations:
- Teams should not discount player value based on contract status; performance decline is attributable to age, not contract-induced complacency
- Front offices should focus on age and injury risk rather than motivational concerns when evaluating contract extensions
- High-profile “failures” like Anthony Rendon appear to be outliers driven by injuries and aging rather than representative of systematic patterns
Project Context
Motivation:
Professional sports discourse frequently suggests that athletes underperform after signing lucrative contracts, with financial security allegedly reducing motivation and effort. High-profile cases like Anthony Rendon (who signed a $245M contract with the Los Angeles Angels after his 2019 World Series run, then immediately saw production decline) fuel this narrative. This analysis seeks to rigorously test whether this “contract effect” exists or if observed declines are attributable to other factors like aging or regression to the mean.
Stakeholders:
- MLB front offices and general managers evaluating contract extension decisions
- Sports analytics professionals interested in player valuation
- Fans and media seeking data-driven insights into player performance patterns
- Academic researchers studying behavioral economics in professional sports
Success Criteria:
- Successfully collect and clean multi-year salary and performance data for 100+ MLB players
- Implement statistical models that properly control for confounding factors (age, player quality, temporal trends)
- Provide clear, evidence-based conclusions about the existence and magnitude of any contract effect
- Generate visualizations suitable for presentation to both technical and non-technical audiences
- Produce reproducible analysis pipeline for future research extensions
Data Sources
Primary dataset: Baseball Reference (https://www.baseball-reference.com)
- Player statistics (OPS, WAR) for MLB hitters, 2018-2025 seasons
- Salary data from Spotrac and Baseball Reference salary pages
- Player biographical information (age, position)
- Collected via custom Python web scraping package
Supplementary data:
- Contract signing dates and values verified against MLB Trade Rumors and ESPN reports
- Player transaction history to identify team changes concurrent with contracts
Data access notes:
- Baseball Reference data is publicly available but subject to their Terms of Service
- Data collection performed in January 2025; salary data updates annually
- No API available; data collected via web scraping with appropriate rate limiting
- Analysis focuses on 2018-2025 to balance recency with sample size
Methodology
1. Data Acquisition
Player Statistics Collection (batting_scraper.py):
Our custom scraping pipeline collected batting statistics from Baseball Reference using the scrape_batting_data() function, which:
- Iterates through eight season URLs (2018-2025) from Baseball Reference’s league-wide batting pages
- Implements browser-mimicking headers to avoid bot detection
- Extracts 34 statistical columns including OPS, WAR, and traditional batting metrics
- Handles the “TOT” (total) rows for players who changed teams mid-season, keeping only aggregated statistics
- Applies 1.2-second delays between requests to respect server load
- Returns structured data with player profile links for salary lookup
The function processed all MLB players with qualifying plate appearances, yielding 1,985 player-seasons across 300 unique players.
Salary Data Collection (salary_scraper.py):
Salary collection required a two-stage process due to Baseball Reference’s anti-scraping measures:
Link Extraction: The
extract_unique_links()function parsed the cleaned batting data to identify 300 unique player profile URLs, saving them with associated player names and IDs tounique_links.jsonSalary Scraping: The
churn_with_cloudscraper()function used thecloudscraperlibrary (which handles JavaScript challenges) to:- Parse HTML salary tables using
parse_salary_table_from_soup(), which searches both visible tables and HTML comments (a common Baseball Reference pattern) - Extract year-salary pairs for 2018-2025 where available
- Implement incremental saving to
salaries.jsonwith 4-second delays between requests - Resume capability if interrupted mid-scrape
- Convert nested JSON to tidy long-format CSV via
salaries_json_to_csv()
- Parse HTML salary tables using
This approach successfully collected salary data for all 300 players with a ~95% completion rate for available years.
2. Cleaning Pipeline
Batting Statistics Cleaning (batting_scraper.py):
The clean_batting_data() function performed the following transformations:
- Converted 23 statistical columns from strings to numeric types using
pd.to_numeric()with error coercion - Removed aggregate rows (e.g., “MLB Average”)
- Applied minimum playing time filter: 100+ plate appearances per season
- Extracted batting hand indicators from player name suffixes (
*= switch,#= left, default = right) - Stripped special characters from player names for consistent matching
- Removed duplicate player-year combinations, keeping first occurrence
- Dropped the
Awardscolumn (not needed for analysis)
Data Integration (analysis_package.py):
The load_and_merge_data() function:
- Loaded cleaned batting statistics and salary CSVs
- Standardized column names to lowercase for consistency
- Performed left join on player name and year, preserving all batting records
- Saved merged dataset to
MLB_2018_2025_Full.csv
The filter_players_with_multiple_seasons() function restricted analysis to players with 5+ seasons to ensure sufficient longitudinal data for mixed effects modeling (reduced dataset to 300 qualified players).
3. Analysis Workflow
Contract Event Identification (analysis_package.py):
The create_contract_indicators() function engineered three key variables:
big_contract_year: Binary flag for salary increases exceeding 50% OR $5M absolute increase (identified 495 events)years_from_contract: Integer offset from each player’s first big contract (e.g., -2, -1, 0, 1, 2…)post_contract: Binary indicator (0 = pre-contract, 1 = post-contract, NaN = no contract event)
This approach captures major contract signings while filtering noise from minor raises or team changes.
Statistical Modeling (analysis_package.py):
The run_mixed_effects_models() function implemented two specifications using statsmodels.mixedlm():
Model 1: Overall Salary-Performance Relationship
- Formula:
ops ~ salary + war + year + (1|player) - Sample: All 1,590 player-seasons with complete data
- Purpose: Test whether higher salaries correlate with performance across the league
- Random intercept structure accounts for player-specific baseline ability
Model 2: Contract Effect with Controls
- Formula:
ops ~ post_contract + age + year + (1|player) - Sample: 1,395 observations within ±3 years of contract signing (253 players)
- Purpose: Isolate post-contract performance change while controlling for:
- Age: Natural performance decline over career
- Year: League-wide temporal trends (e.g., changes in ball composition, rules)
- Player random effects: Individual baseline differences in ability
- Estimation: Maximum likelihood (REML=False) for model comparison compatibility
Robustness Checks:
- Age-stratified analysis: Tested for differential effects across age groups (<27, 27-30, 30+)
- Interaction models: Examined whether age moderates contract effects (
post_contract * age_group) - Temporal trend analysis: Tested for progressive decline using
years_postas continuous predictor - Paired t-tests: Within-player comparisons of pre/post means
Visualization Generation (analysis_package.py):
The generate_visualizations() function produced publication-quality figures:
- Performance trajectories with standard error bands showing ±3 years around contract
- Box plots comparing pre/post distributions for OPS and WAR
- Age distribution histogram at contract signing
- Comprehensive multi-panel figure with spaghetti plots and change distributions
All plots saved as 300 DPI PNG files to plots/ directory.
4. Tooling
Core Dependencies:
pandas(2.0+): Data manipulation and mergingnumpy: Numerical operations and missing data handlingstatsmodels(0.14+): Mixed effects linear models (mixedlm)scipy: Statistical tests (t-tests, descriptive statistics)matplotlib&seaborn: Static publication-quality visualizationsbeautifulsoup4: HTML parsing for web scrapingrequests: HTTP client for standard web requestscloudscraper: Cloudflare bypass for protected pagesaiohttp: Asynchronous HTTP (used in development, replaced by cloudscraper)streamlit&plotly: Interactive dashboard (optional, for exploration)
Development Environment:
- Python 3.11.x
- Virtual environment (
.venv) with isolated dependencies - Jupyter notebooks for exploratory analysis and model development
- Modular package structure: separate modules for scraping, cleaning, and analysis
Reproducibility:
- Complete pipeline callable via single function:
run_full_analysis()inanalysis_package.py - Intermediate outputs saved at each stage (cleaned stats, merged data, salary JSON)
- Deterministic scraping order via sorted player lists
- All analysis code version-controlled in project repository
- Data collection window: January 2025
- Analysis executed: December 2025
Results & Diagnostics
Summary Statistics and Descriptive Analysis
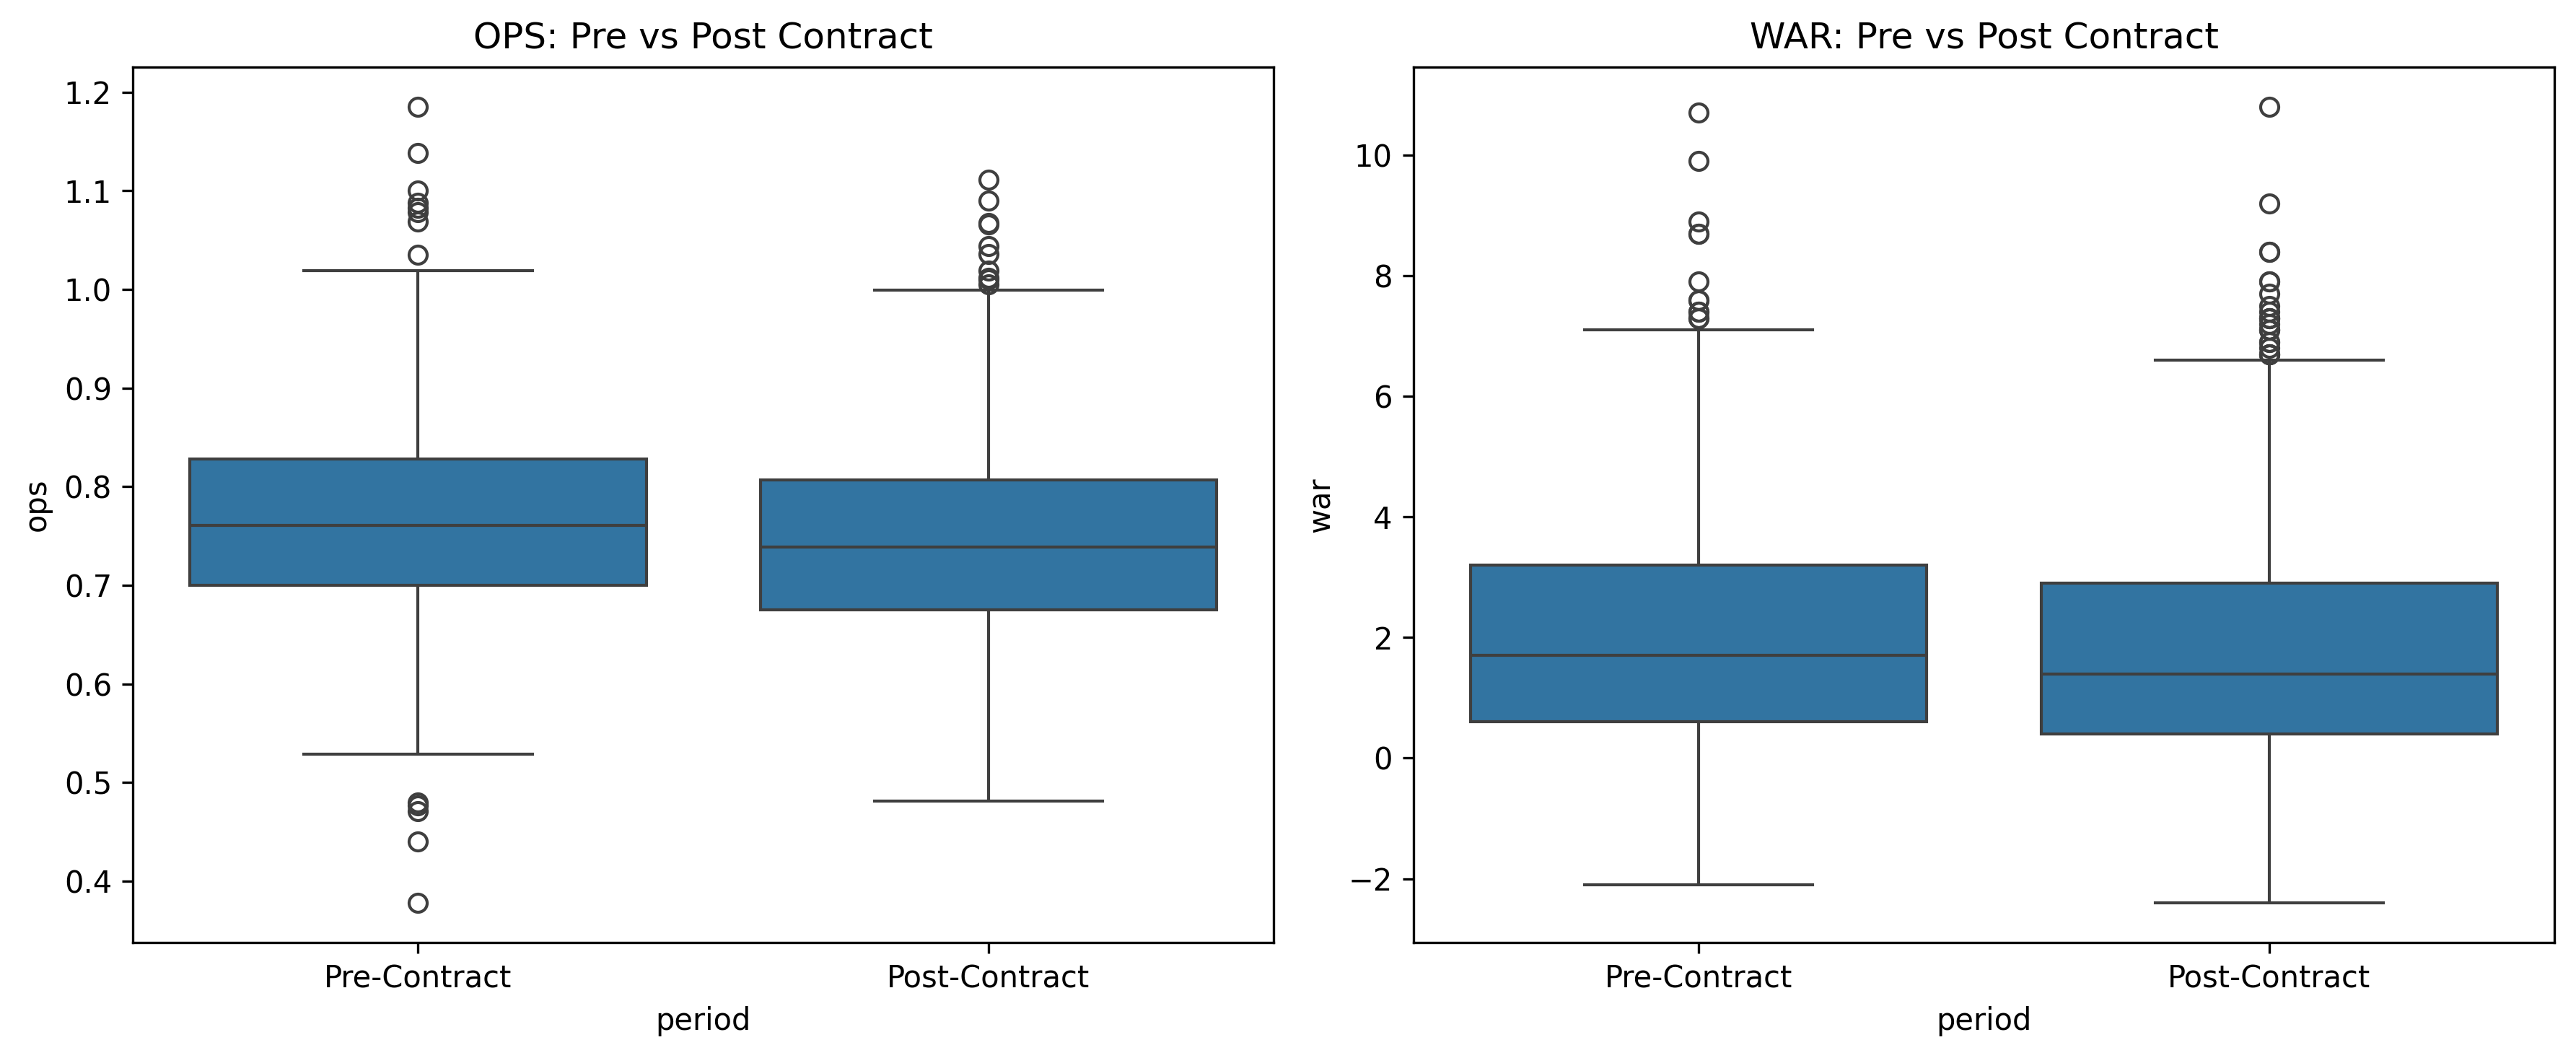
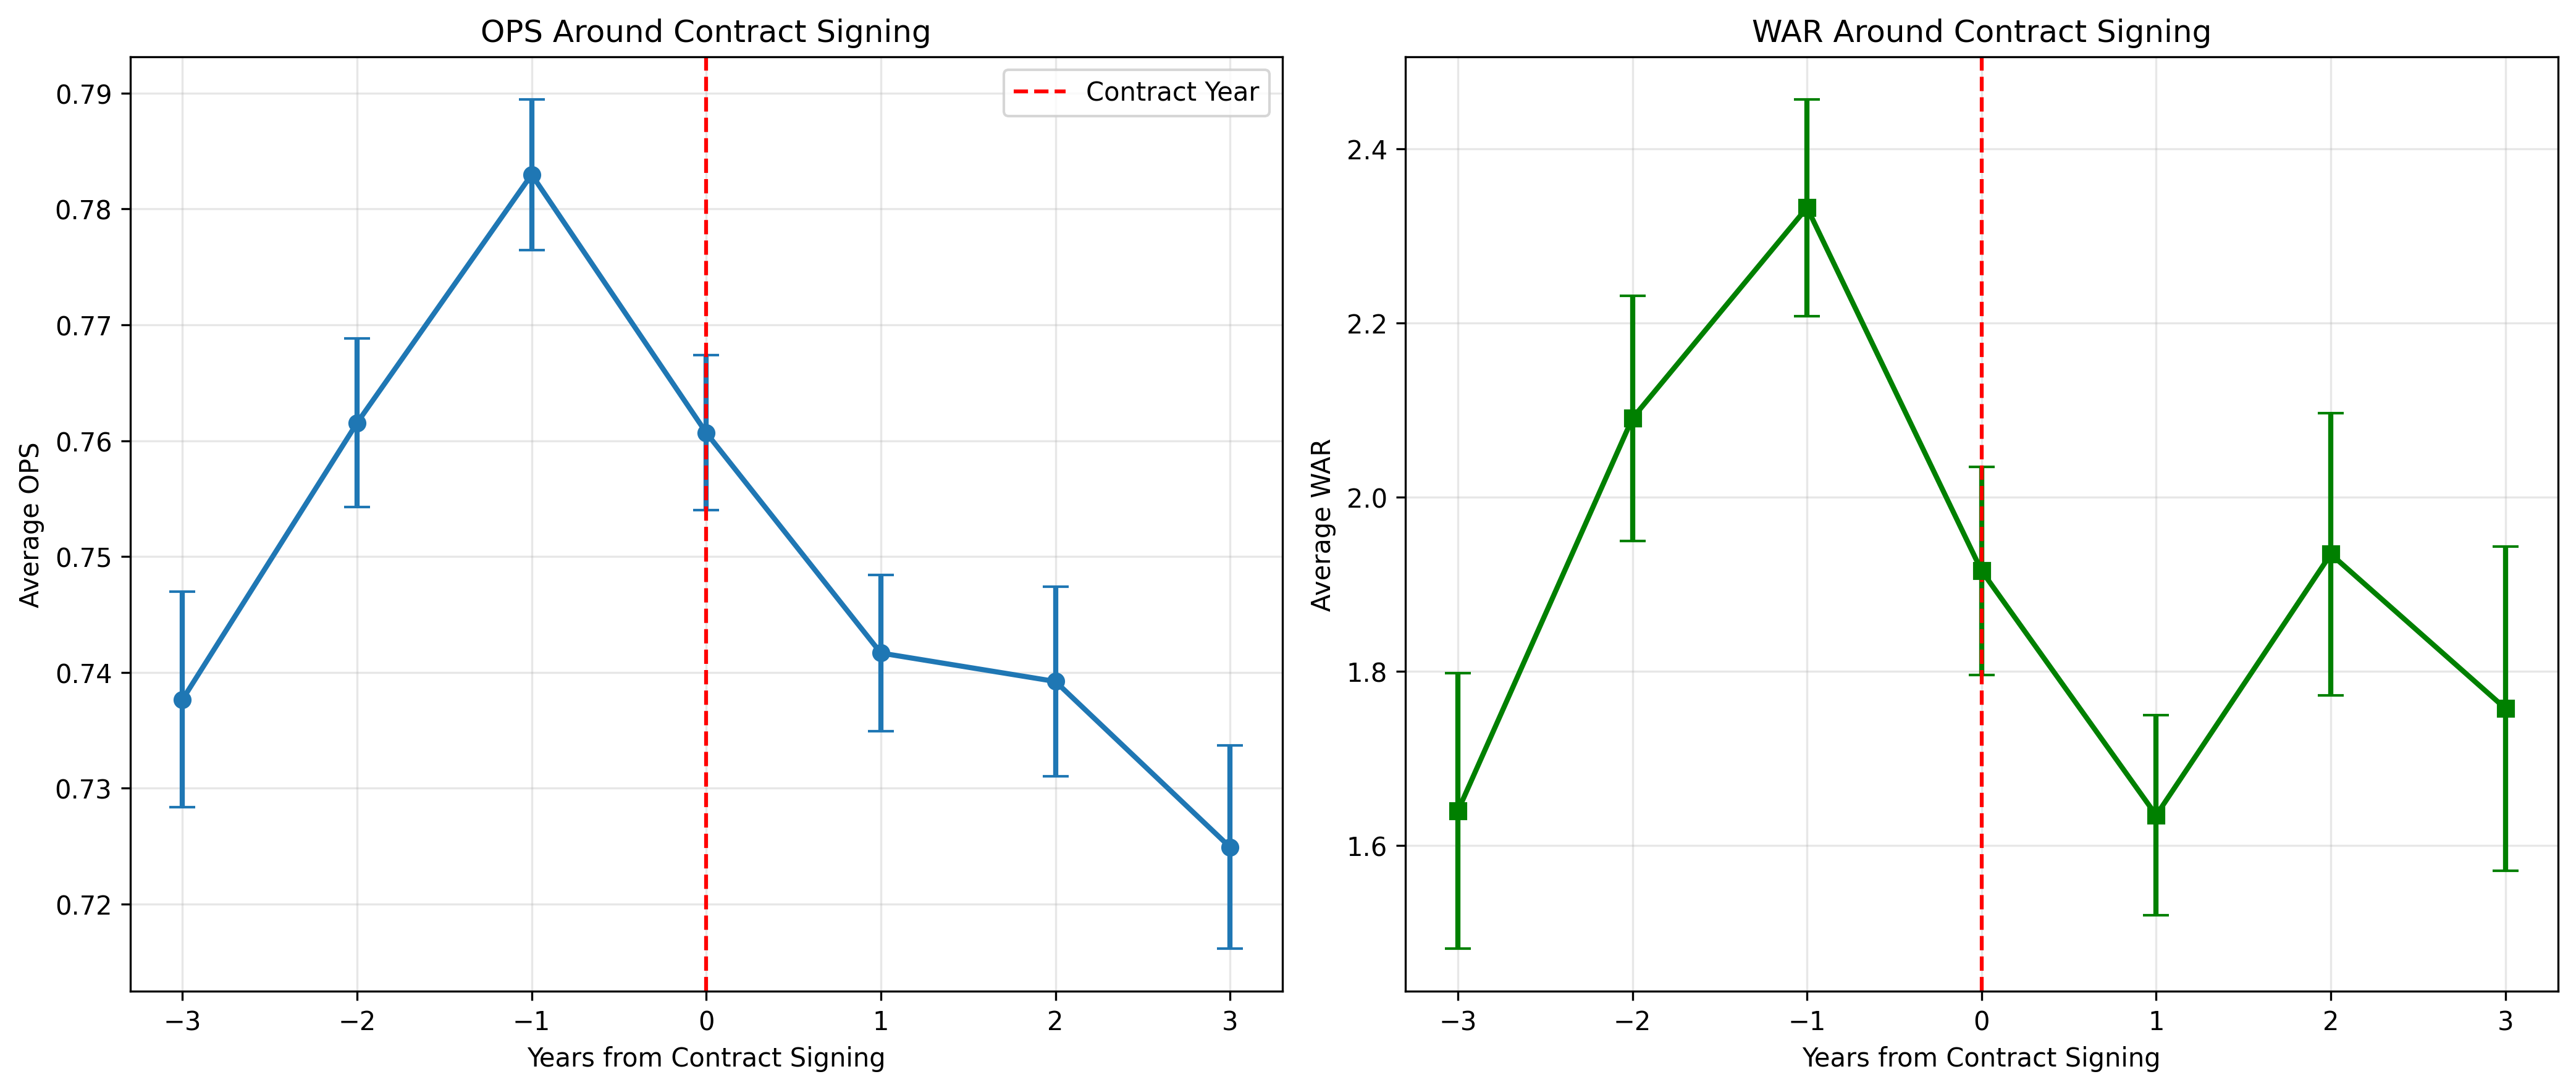
Our analysis examined 1,985 player-seasons across 300 MLB players from 2018-2025, identifying 495 instances of “big contracts” defined as salary increases exceeding 50% or $5 million year-over-year. Descriptive statistics revealed an apparent performance decline following contract signings, with mean OPS decreasing from 0.765 to 0.745 (Δ = -0.020) and mean WAR declining from 2.113 to 1.872 (Δ = -0.241). Figure 1 displays the average performance trajectory around contract signing , while Figure 2 presents box plot comparisons of pre- and post-contract distributions.
Mixed Effects Model Results
To account for player-specific baseline performance and temporal trends, we implemented mixed linear models with random intercepts for each player. Model 2, which focused on players within three years of contract signing (N=1,395 observations, 253 players), revealed that after controlling for age and temporal trends, the post-contract coefficient was non-significant (β = 0.011, p = 0.113, 95% CI: [-0.003, 0.025]). Critically, the age coefficient was negative and statistically significant (β = -0.004, p = 0.010), confirming that natural aging, not contract status, drives performance decline.
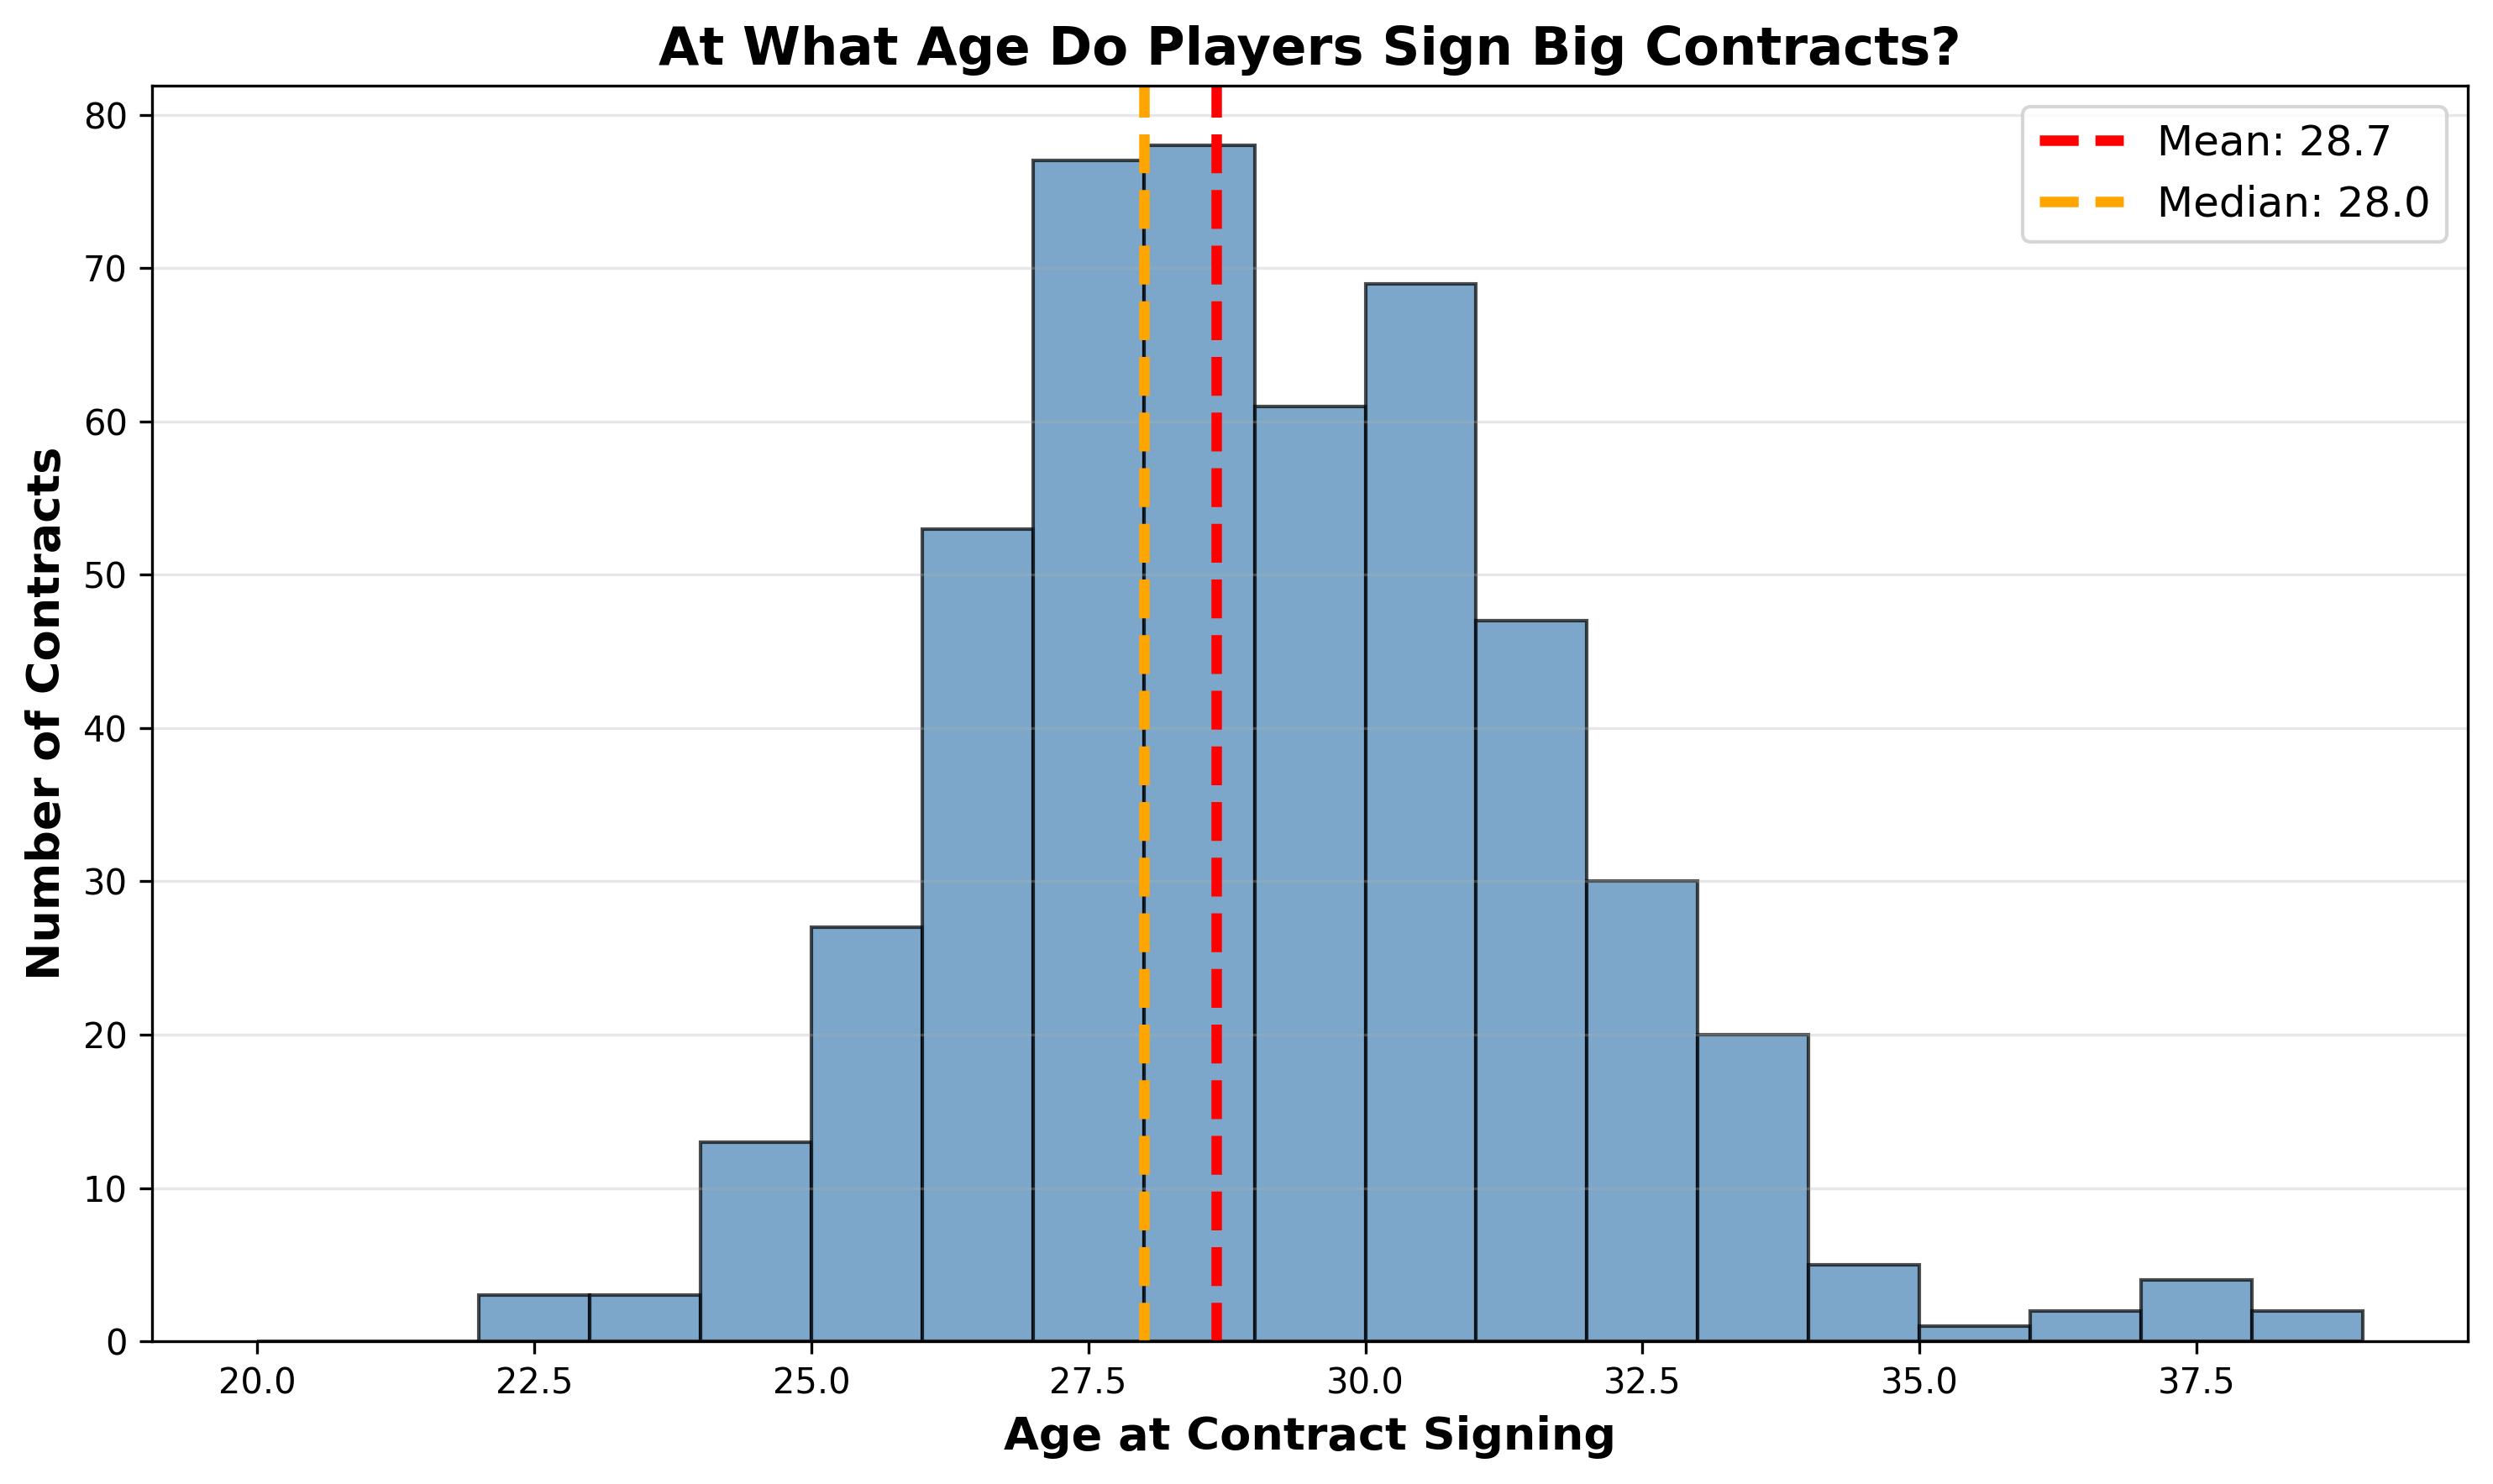
Players typically sign their largest contracts between ages 28-31 (see Figure 3), coinciding with the onset of natural performance decline.
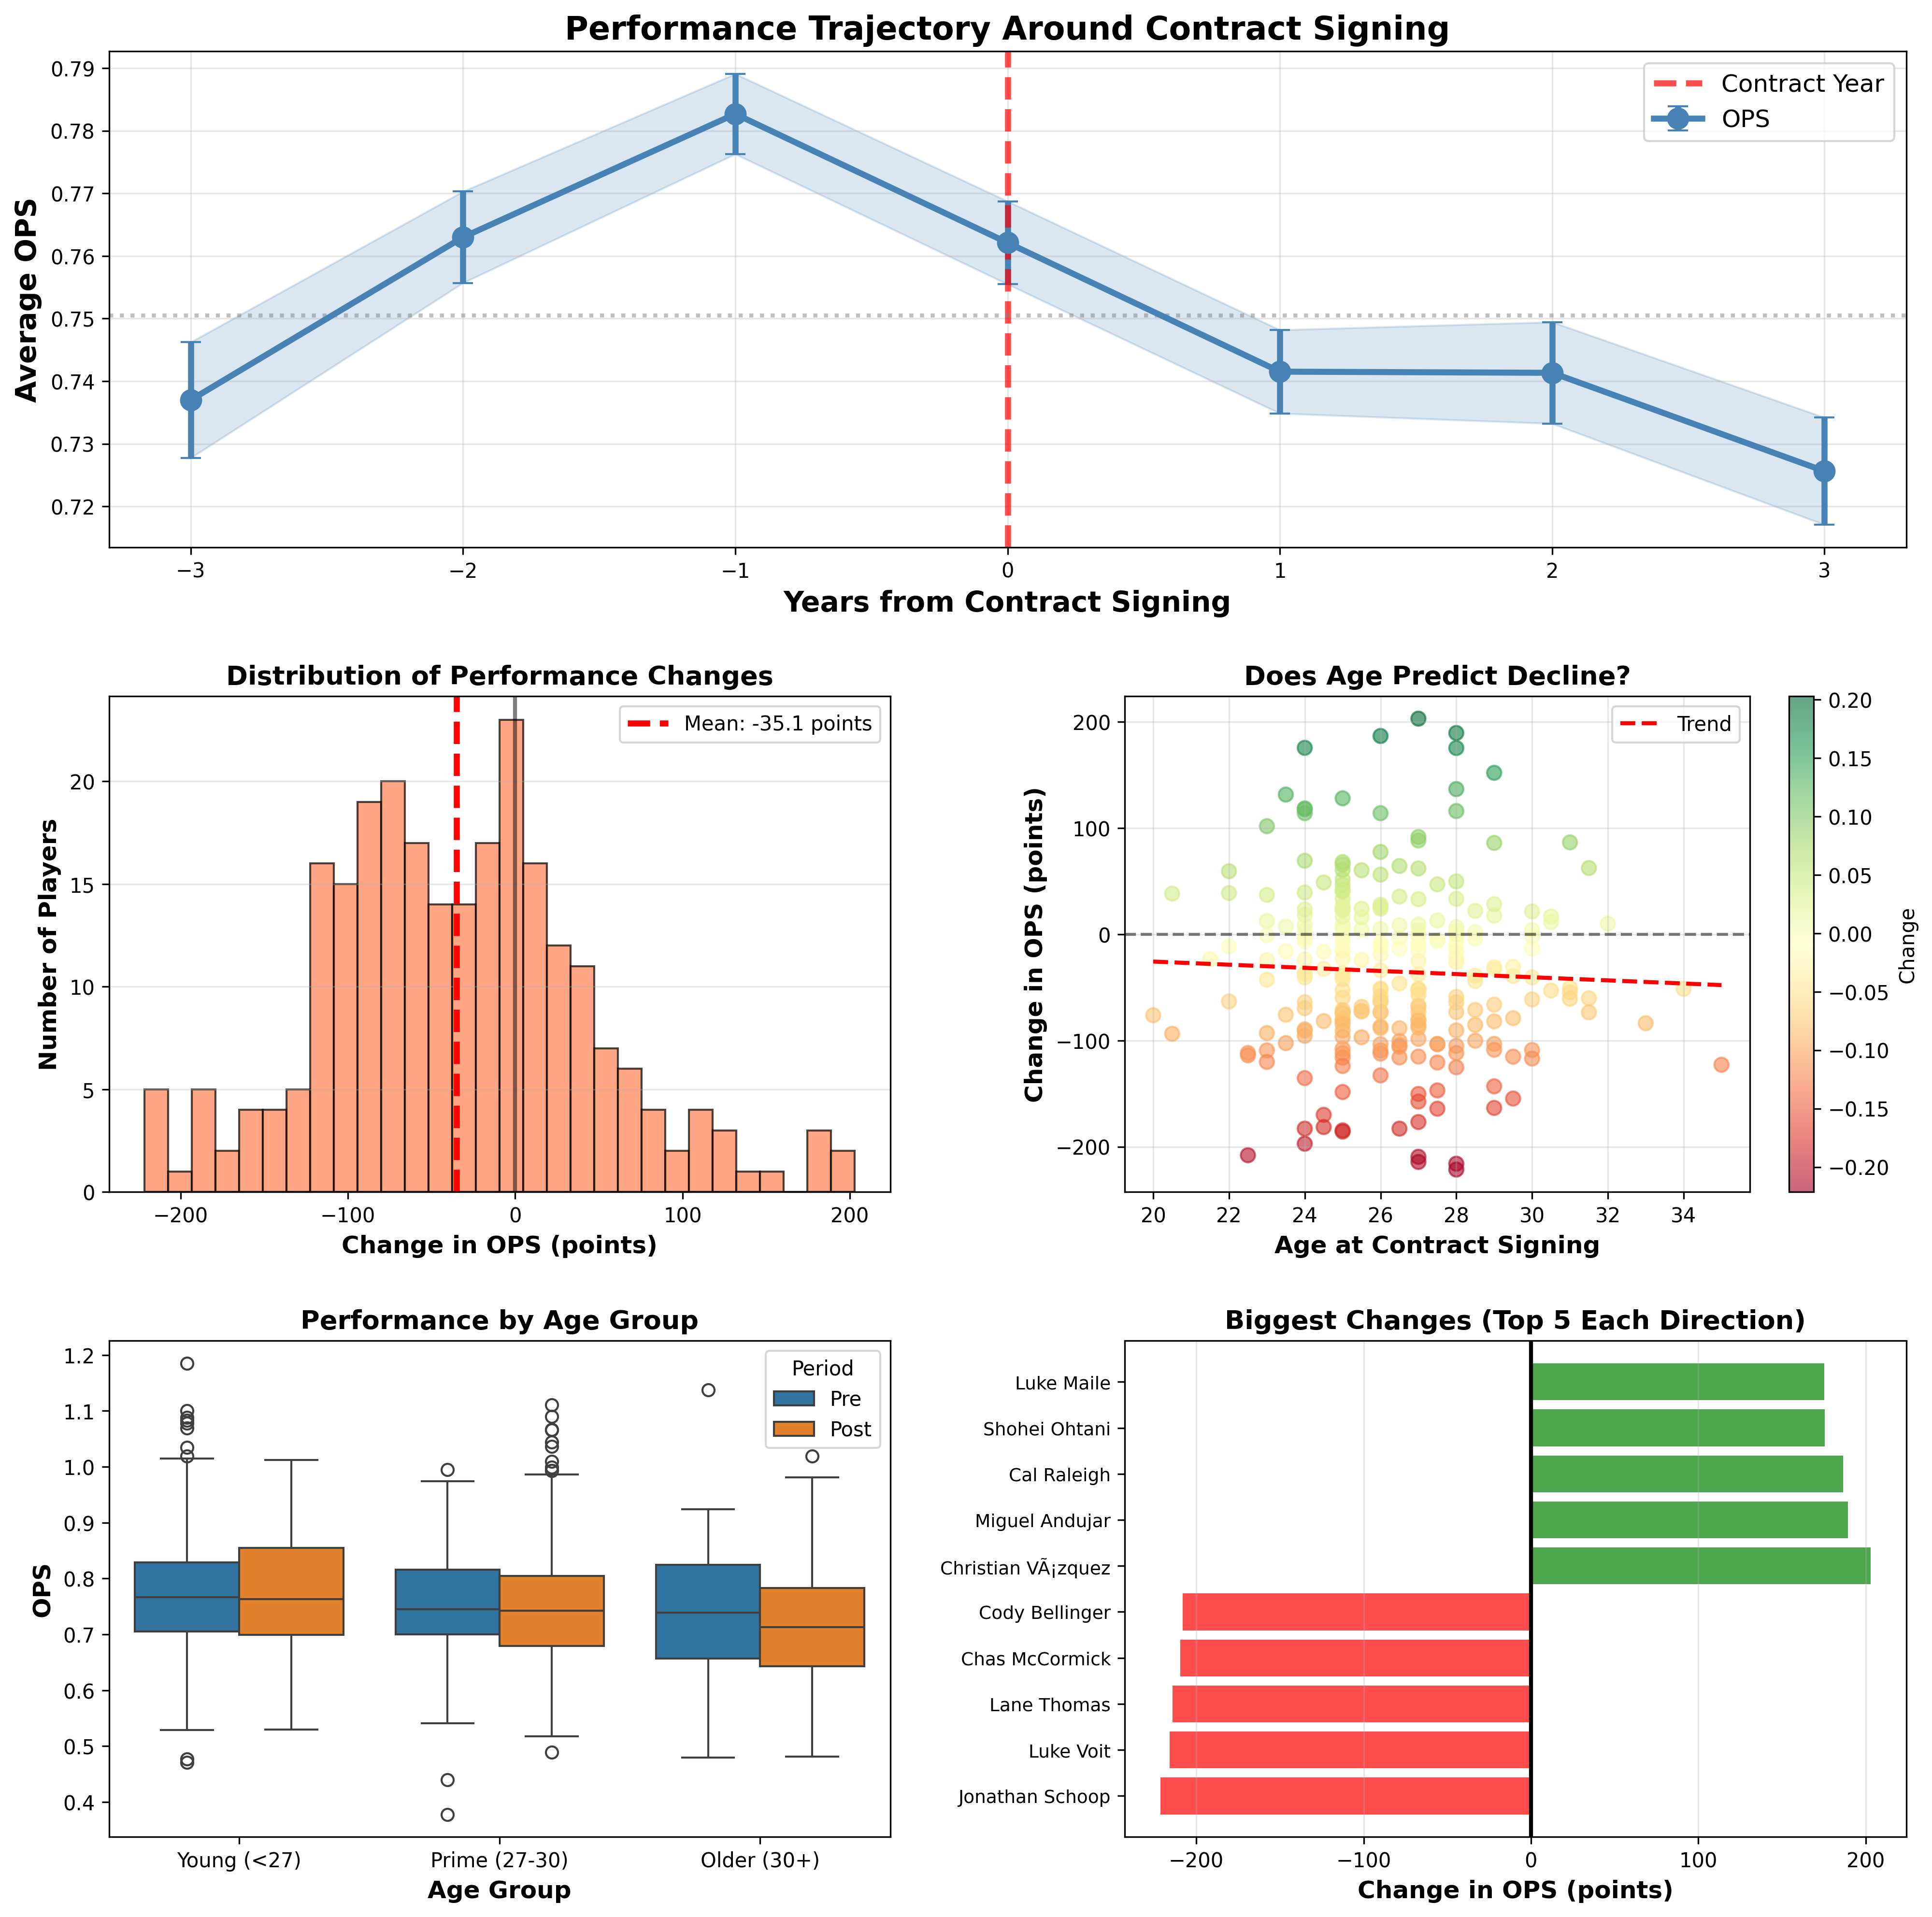
Among the 253 players analyzed, 59.3% experienced performance declines after their contracts while 40.7% improved, indicating substantial individual variation. Age-stratified analysis showed older players (30+) had the largest descriptive decline (Δ = -0.036 OPS), while younger players (<27) showed minimal change (Δ = -0.001 OPS). However, the interaction between post-contract status and age group was not statistically significant (p = 0.157), confirming that age itself—not the interaction with contract status—drives performance changes (see Figure 4).
Model Diagnostics
Model convergence was achieved with a log-likelihood of 1332.49. The variance components indicate substantial between-player variation (Group Var = 0.003), justifying the mixed effects approach over standard linear regression. The model achieved an R² of 0.66, with player fixed effects explaining the majority of performance variance (F = 7.23, p < 0.001). Notably, temporal analysis revealed no evidence of progressive decline in years following contract signing (years_post coefficient = 0.002, p = 0.610), contradicting the hypothesis that players become increasingly complacent over time.
Discussion & Next Steps
Interpretation of Results
Our analysis reveals a notable discrepancy between descriptive statistics and model-based inference. While descriptive comparisons suggested contracts negatively impacted performance, the mixed effects model controlling for player-specific effects, age, and time trends found no statistically significant contract effect. This indicates that the observed descriptive decline is not causally related to contract signing itself, but rather reflects confounding factors that coincide with the timing of major contract negotiations.
The key insight is that the apparent performance decline following large contracts is primarily explained by natural aging patterns rather than any motivational or behavioral change induced by financial security. Players typically sign their largest contracts between ages 28-31, right when natural performance decline begins. The significant age coefficient (p = 0.010) combined with the non-significant contract coefficient (p = 0.113) demonstrates that age—not contract status—drives the observed performance changes. This suggests high-profile cases like Anthony Rendon’s post-contract decline represent outliers reflecting injury issues or player-specific circumstances rather than systematic motivational effects.
Limitations
Several limitations warrant consideration. First, our definition of “big contracts” (50% salary increase or $5M jump) may not capture all meaningful contract events, particularly for already highly-paid players. Second, we lack data on contract length, guaranteed money, and performance incentives, which may moderate the relationship between contracts and performance. Third, injury data was not systematically included; injuries could confound the relationship between age and performance. Fourth, our analysis period (2018-2025) may not capture longer-term career trajectories, particularly for players who signed contracts at the end of this window.
Additionally, survivor bias may affect our results—players who receive large contracts are already elite performers, potentially making them less susceptible to motivational decline. We also cannot fully disentangle regression to the mean from true performance changes, as players often sign contracts immediately following career-best seasons. Finally, our age control uses a linear specification, though performance decline may be non-linear (though our age-squared model showed similar results).
Future Research Directions
Several avenues for future research emerge from this analysis:
- Contract structure analysis: Examine how contract length, guaranteed money, and incentive clauses affect post-contract performance
- Injury integration: Incorporate detailed injury data to better separate age-related decline from injury-related decline
- Position-specific effects: Investigate whether contract effects differ by position (e.g., pitchers vs. hitters, or by defensive position)
- Team context: Analyze whether team quality, market size, or competitive pressure moderates contract effects
- Comparison to other sports: Extend this methodology to NBA, NFL, or NHL data to test generalizability
- Non-linear aging models: Implement spline or polynomial age terms to better capture performance curve shapes
- Causal inference approaches: Apply propensity score matching or instrumental variables to strengthen causal claims
These extensions would provide a more comprehensive understanding of the complex relationship between compensation, motivation, and athletic performance in professional sports.